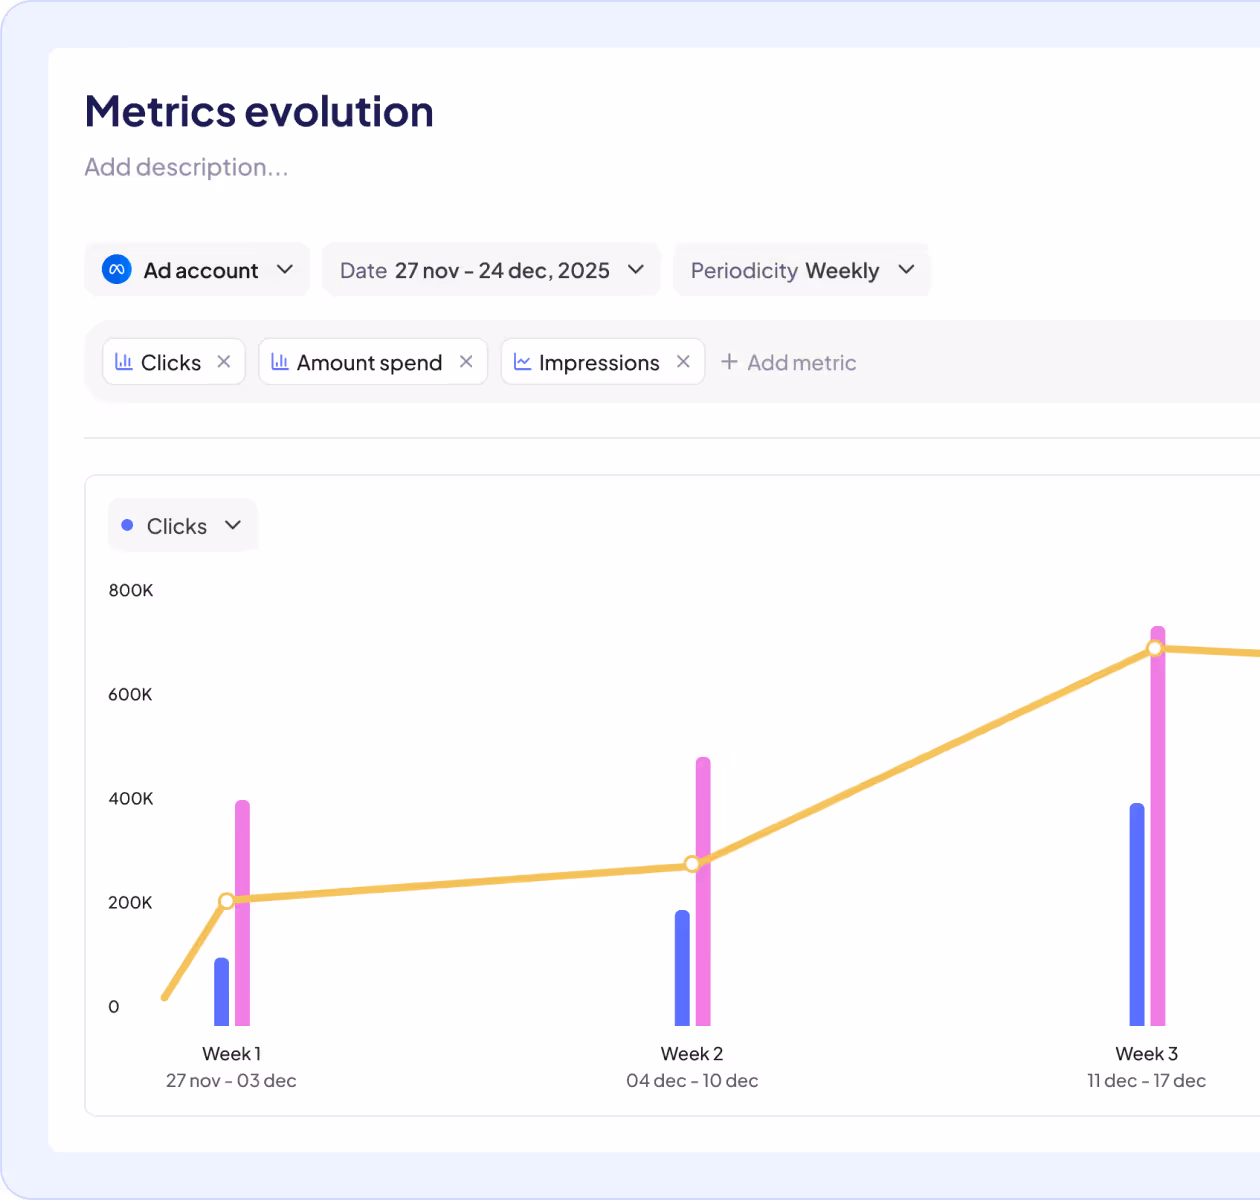
Metrics evolution
Track how your performance evolves over time
Metrics Evolution helps you visualize trends across days, weeks, or months — so you can detect growth patterns, spot slowdowns early, and understand the real impact of your optimizations.


discover the report
Monitor your campaigns’ progress with Metrics Evolution
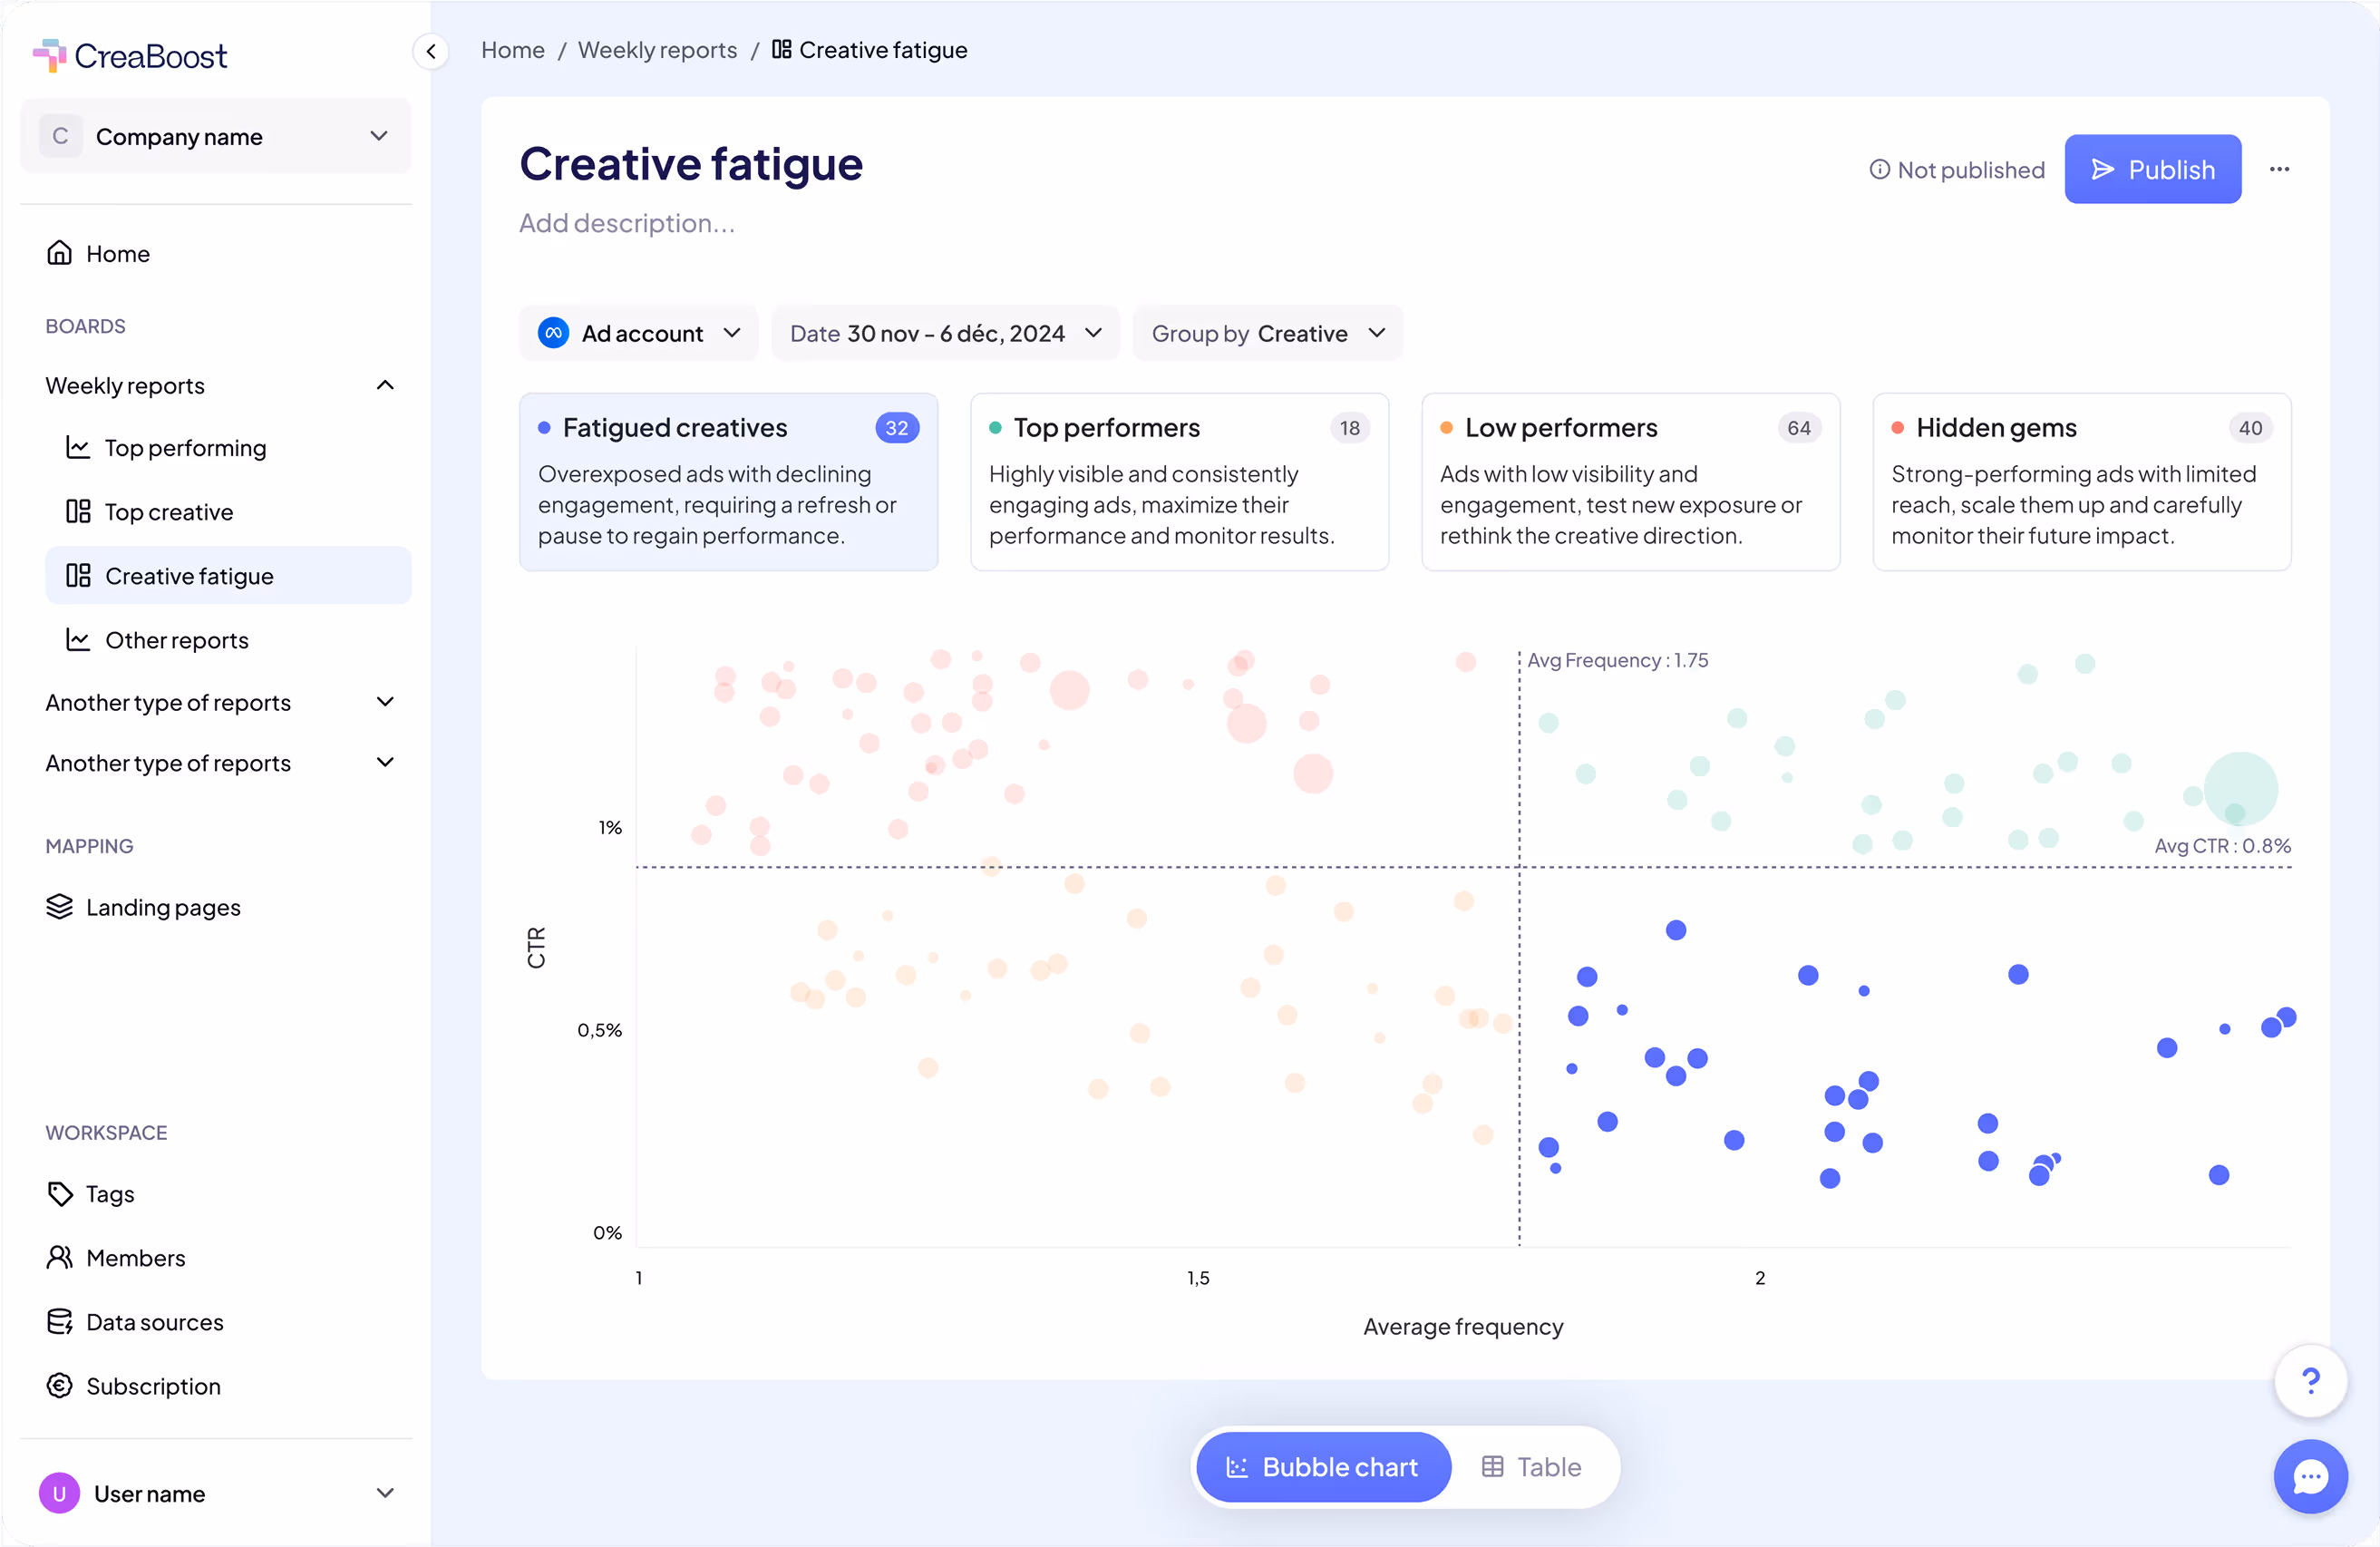
Comparison period
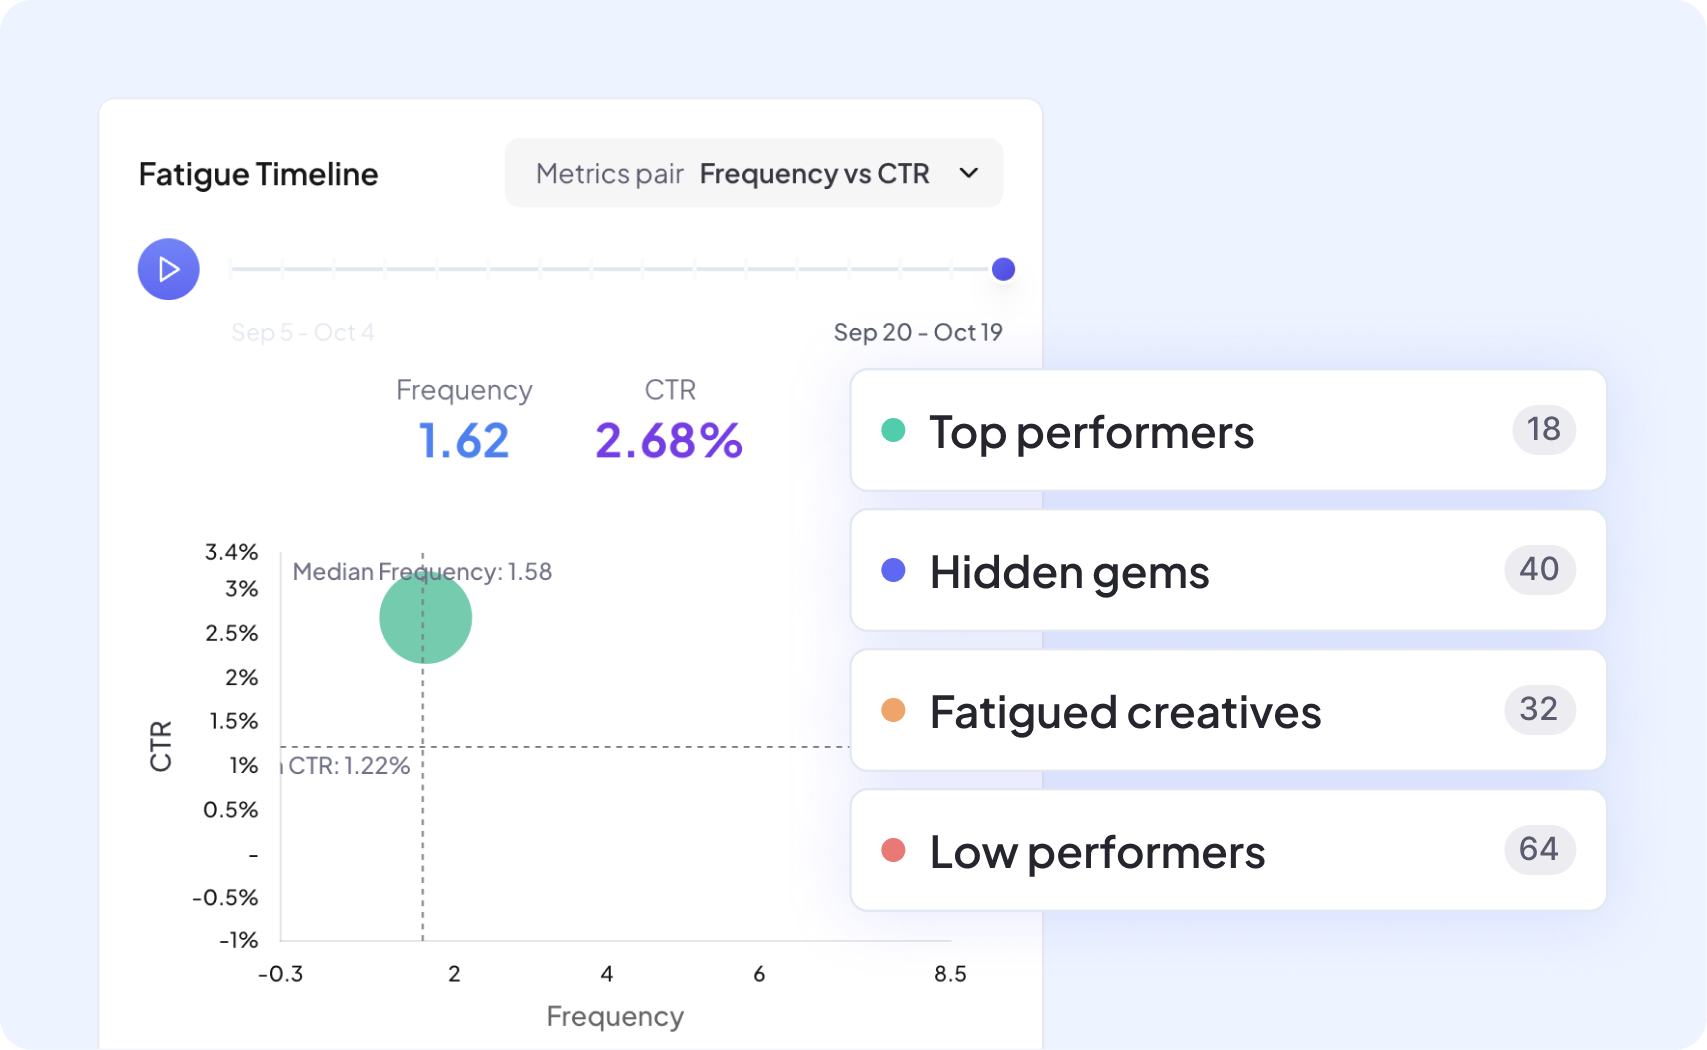
Instantly compare any two periods — week over week, month over month, or custom ranges — to identify growth patterns and seasonality.
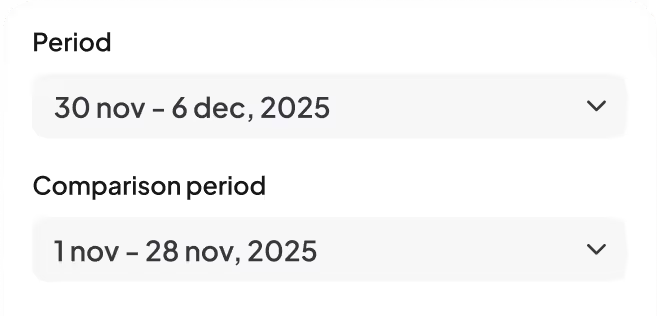
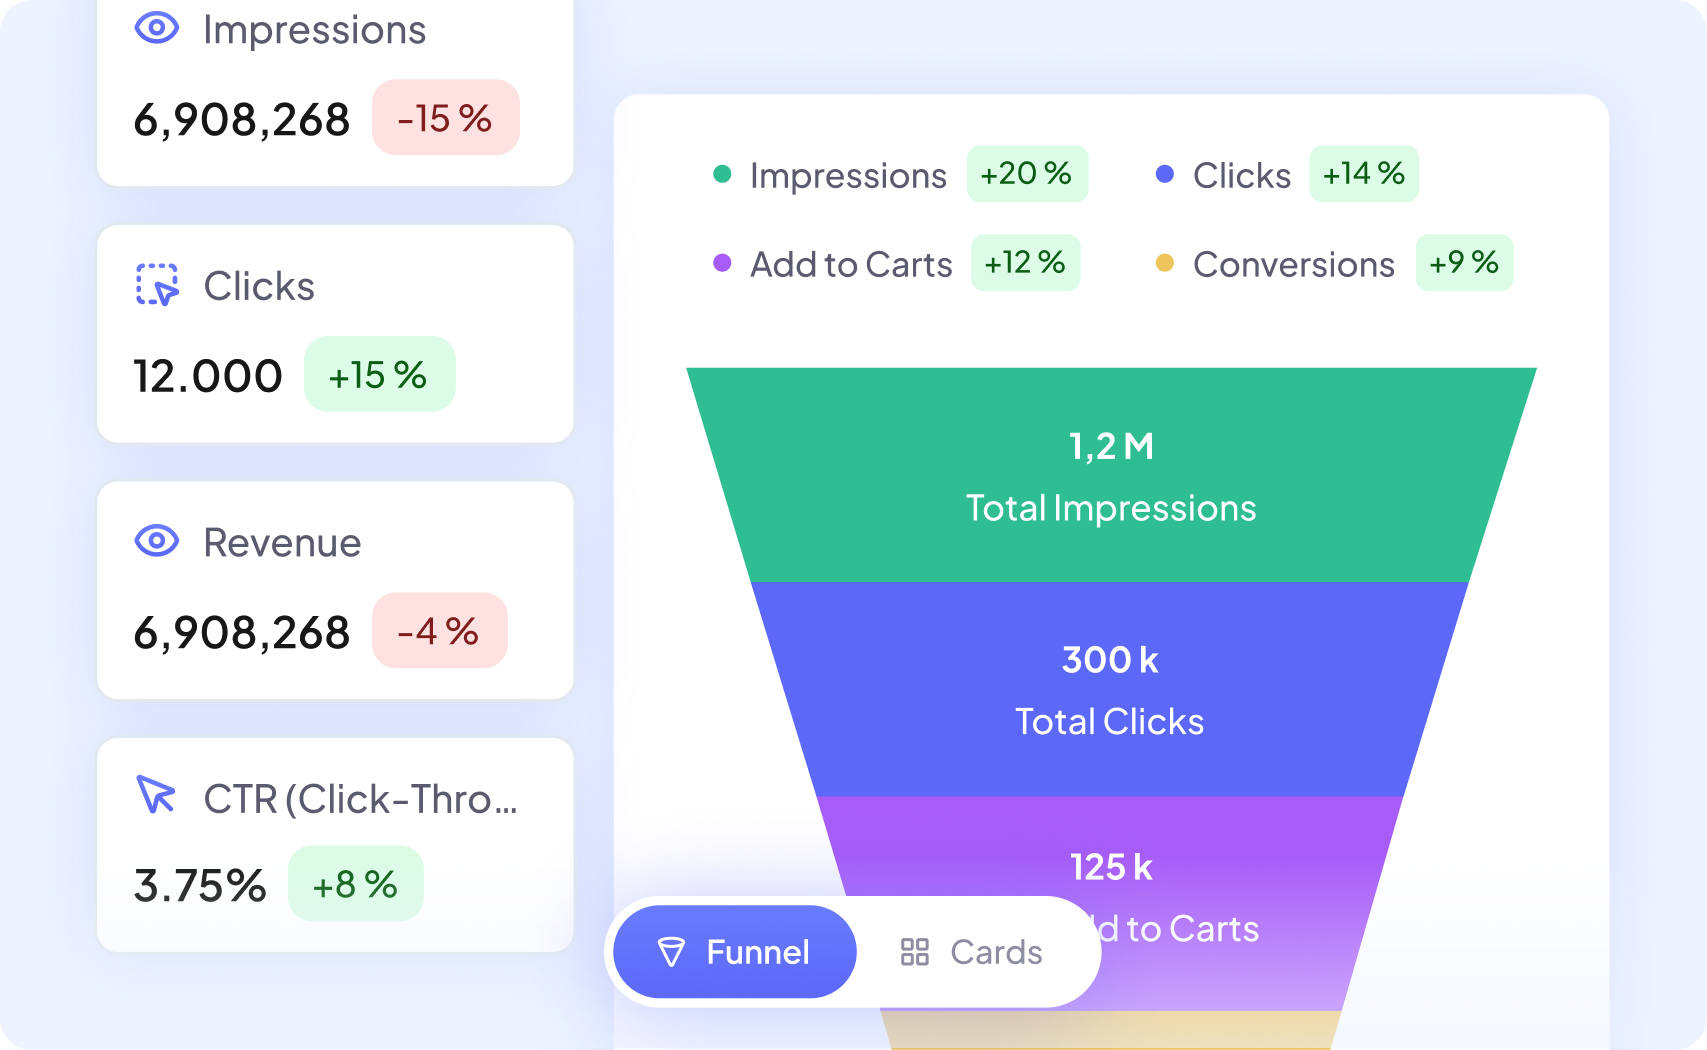
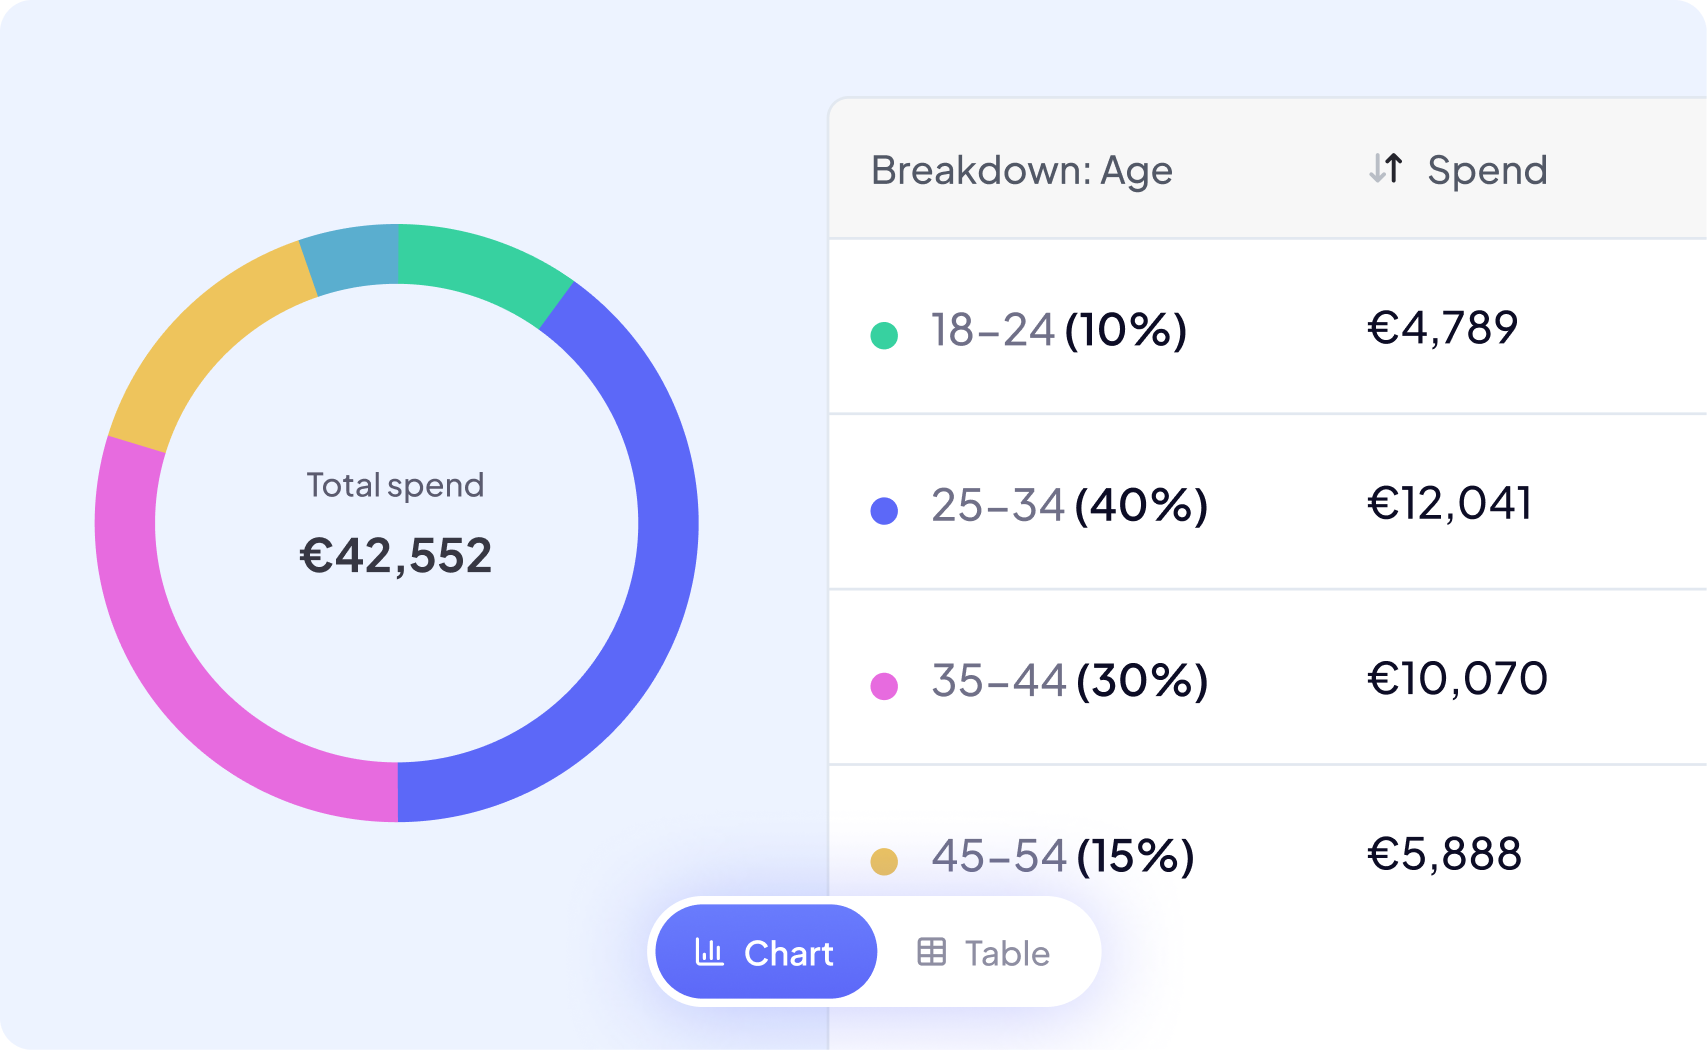
Table or chart view
Switch easily between a detailed table view for precise numbers or a dynamic chart view for a clear visual understanding of your trends.

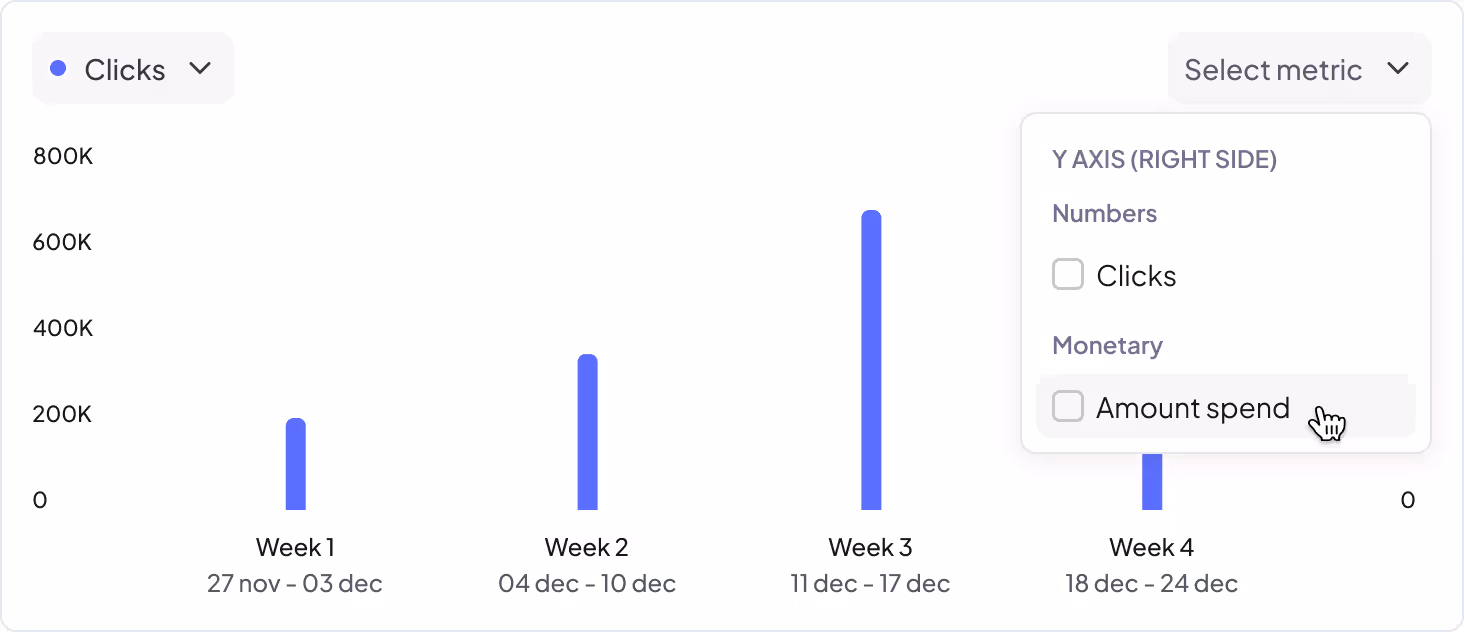
Multi-metric visualization
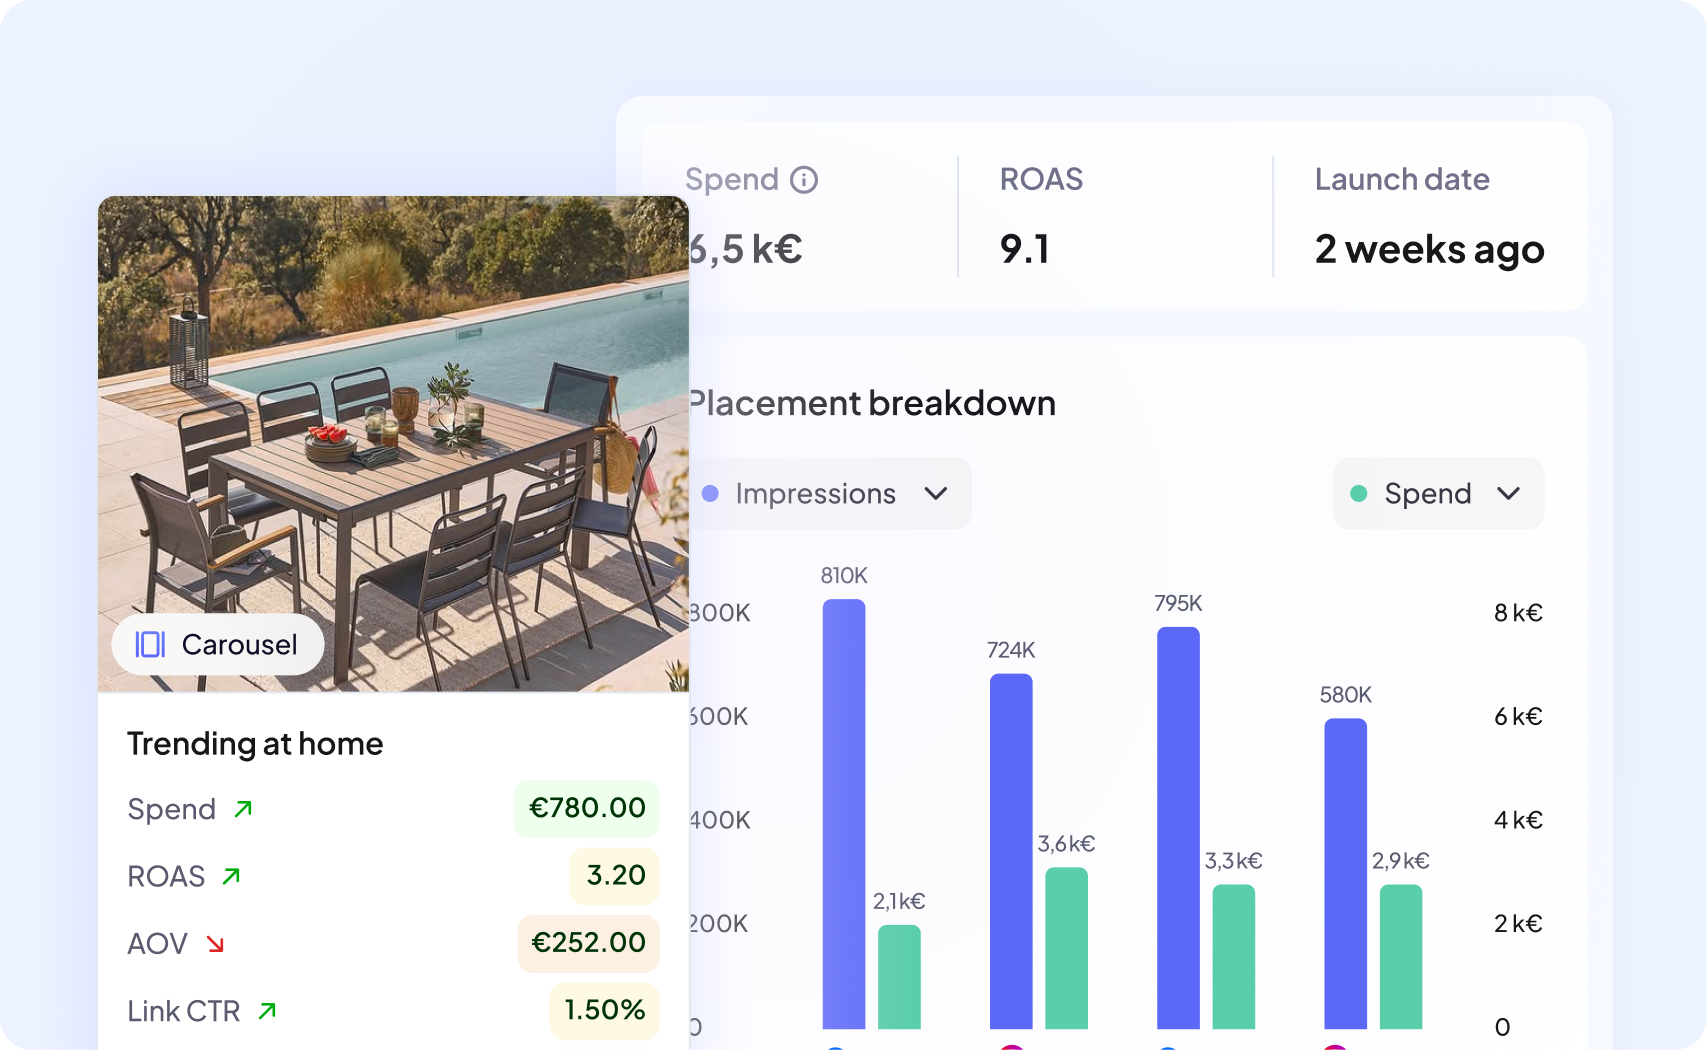
Display up to two metrics simultaneously on dual axes — in line or bar format — to see how spend, CTR, and ROAS evolve together over time.
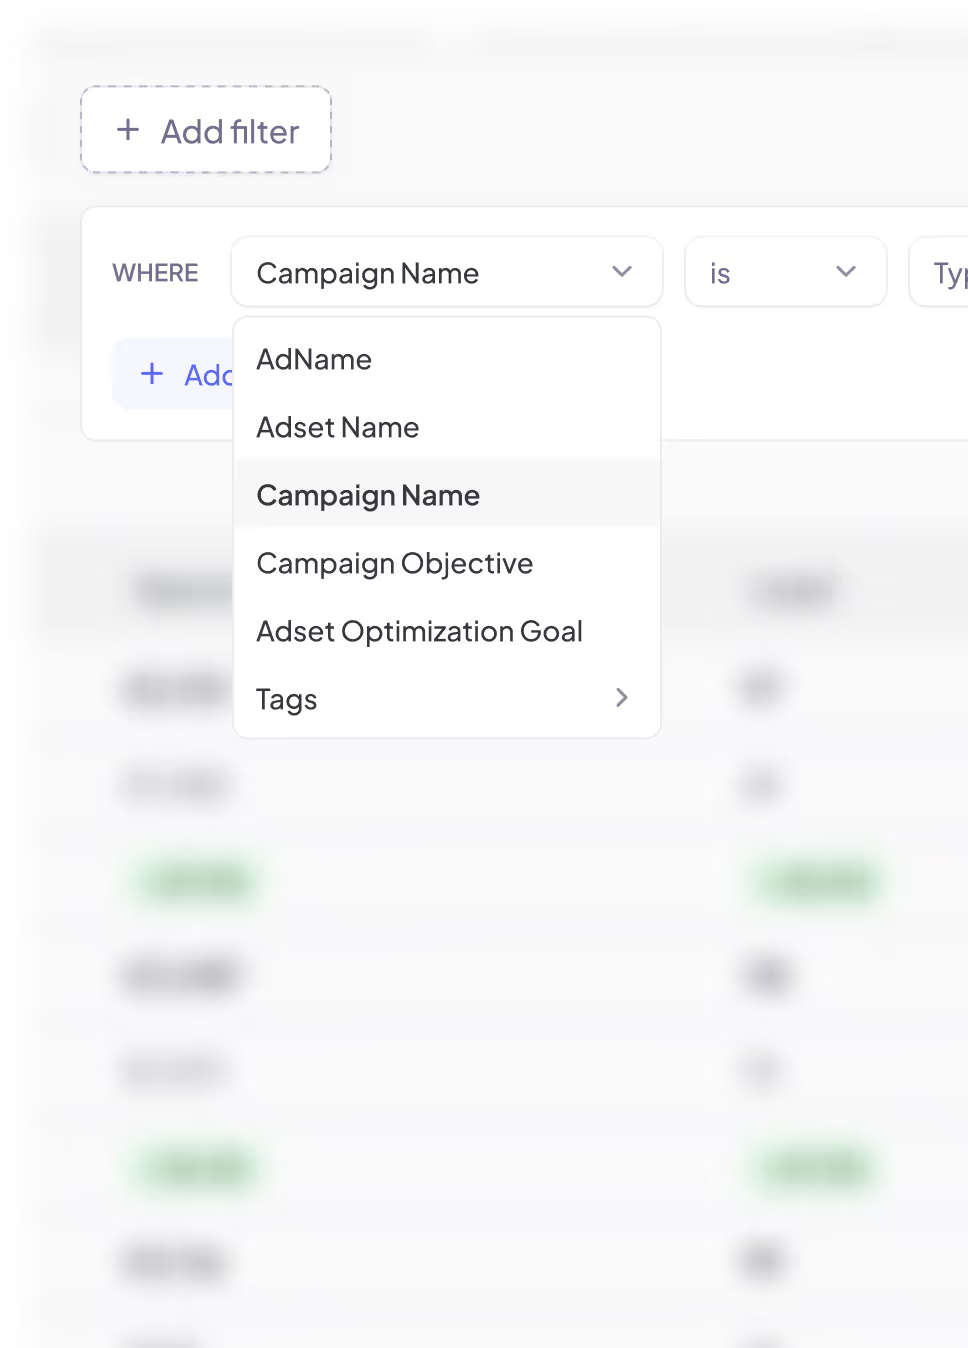
Advanced filtering
Filter your data by campaign, ad set, platform, or audience to focus only on the segments that matter most to your analysis.
Trusted by 100+ agencies
who are winning with CreaBoost


Manon, Creative Strategist @Stride-Up
" The UX of CreaBoost is really well thought out. It’s super easy to use, both for clients and for AMs. Having a clear, visually appealing interface with a view of the creatives and key KPIs has just become essential "
Louis-Michel, General Director @AdBridge
" Creaboost has become a cornerstone of our support at AdBridge. By placing creative strategy at the heart of media performance, this tool allows us to build clear and insightful reports that help our clients precisely identify the creative drivers behind their advertising performance "
Antoine, CEO @Metalyde
"CreaBoost is essential for understanding and optimizing our ad performance. The insights are clear, actionable, and have significantly improved our ROI"
Maïlys, Team Leader Paid Media @Stride-Up
" I love CreaBoost. Honestly, it takes so much time to make something visual to present ad performance... But here, it’s all visual — ecom clients are going to love it. Honestly, the more I dig into this tool, the more I love it "
discover the REPORT in video
Track your performance over time

The most frequently asked questions
Everything you need to know about CreaBoost for agencies. If you need more information or want a full product walkthrough, feel free to book a demo with our team.
How can I distinguish the main data from the comparison period?
The comparison period is displayed with dotted lines, while your main data is shown in solid lines — making it easy to visualize differences at a glance.
Can I change the attribution window?
Yes. You can adjust the attribution window directly within the report to align your analysis with your preferred performance tracking logic.
Can I change the periodicity?
Absolutely. You can view your data daily, weekly, monthly, or yearly to adapt the level of detail to your analysis needs.
Can I choose the axis for each metric?
Yes. Each metric can be assigned to either the left or right axis, allowing you to compare different scales (e.g., spend vs. ROAS) in a single, readable chart.
More features on CreaBoost
Discover way more insights with other key features like Smart tagging, Custom metrics...
Dive deeper into each metric to understand how every element of your ads contributes to performance.
Join 100+ agencies boosting their ads with CreaBoost.

Beautiful dashboards & Smart insights for your creatives.
FOLLOW US ON OUR SOCIALS