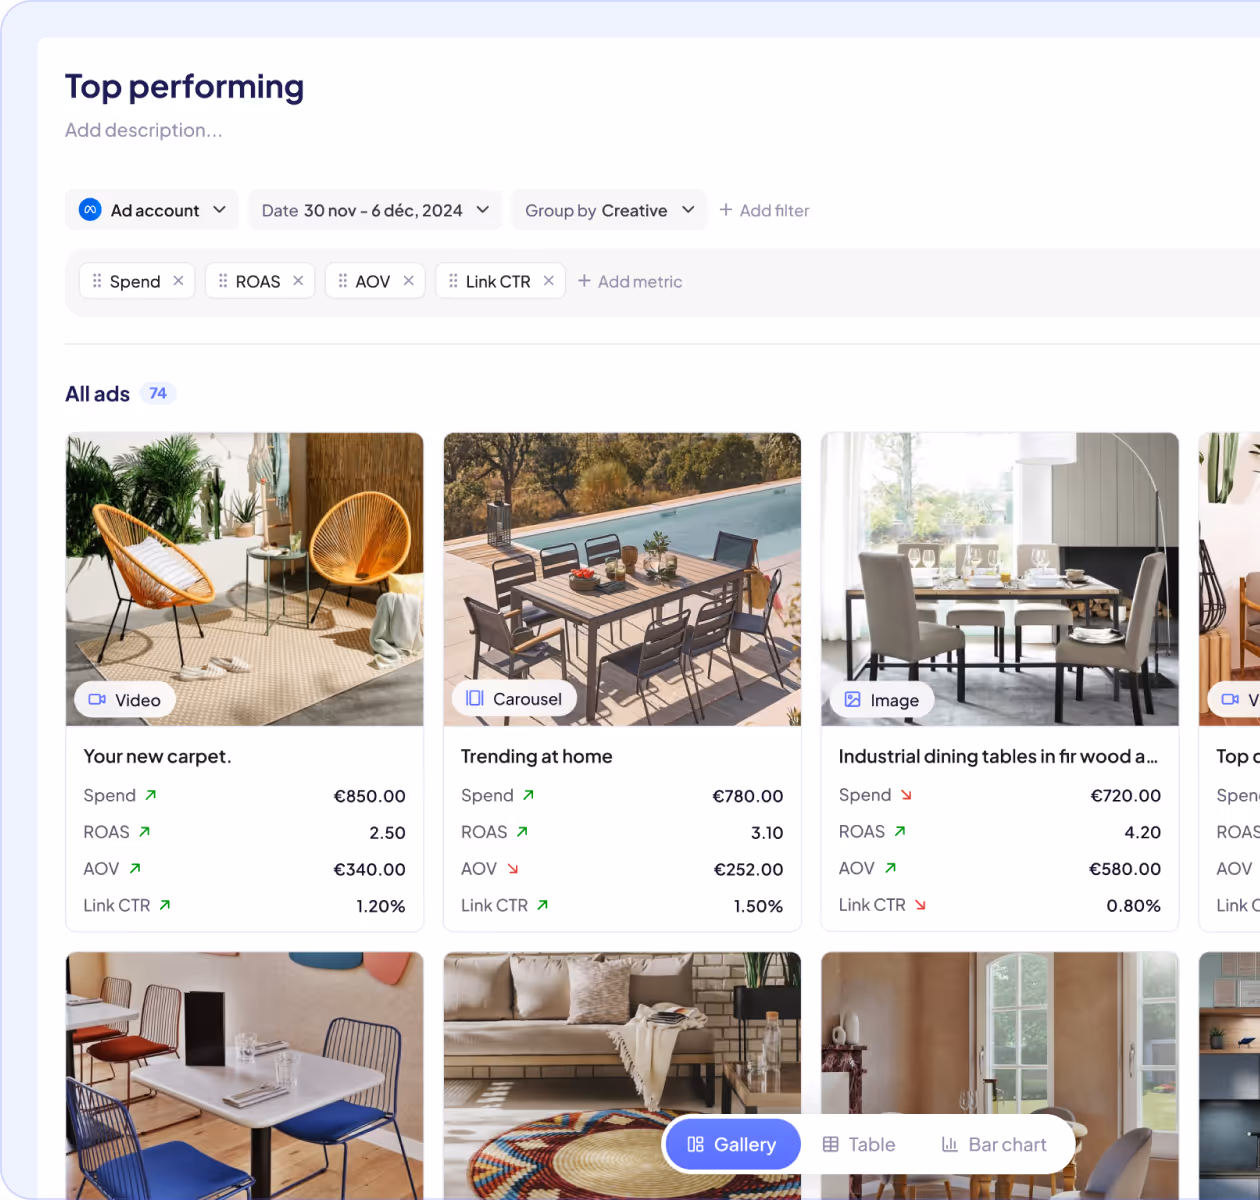
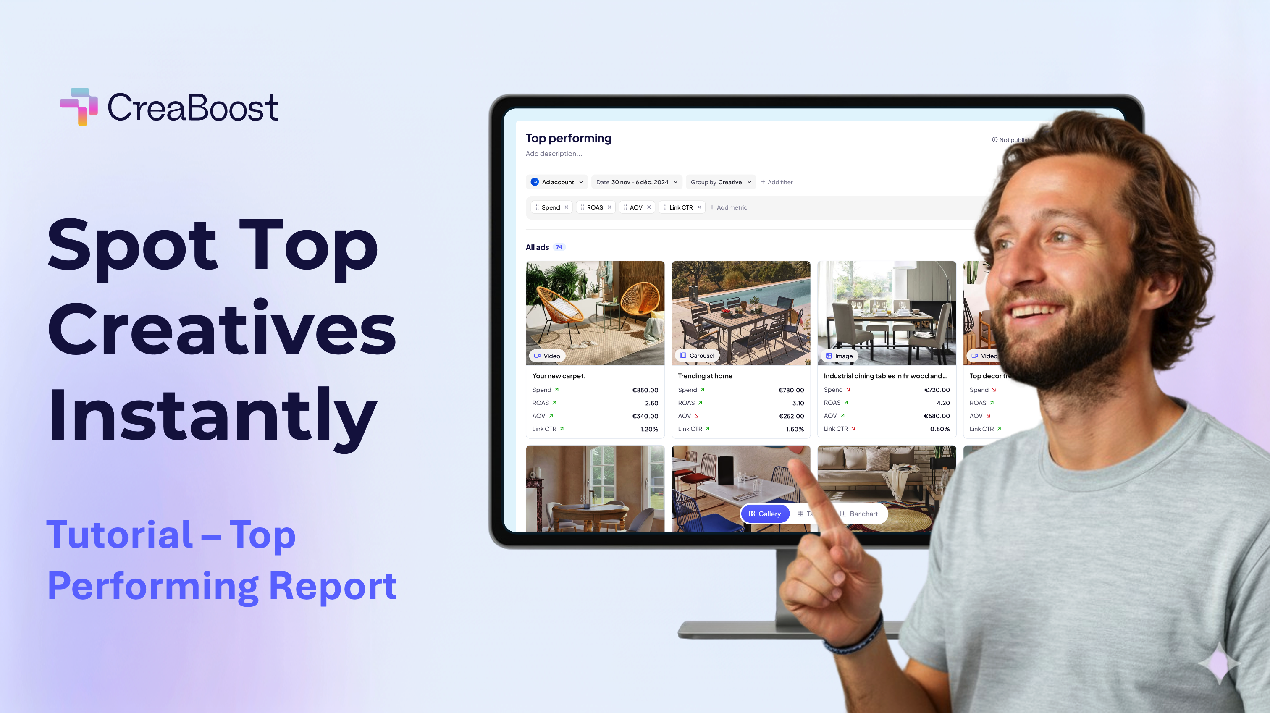
Top performing
Spot your best-performing ads instantly
Our powerful report instantly identifies your top-performing creatives by analyzing the metrics that truly matter.


discover THE report
Scale smarter with top performing
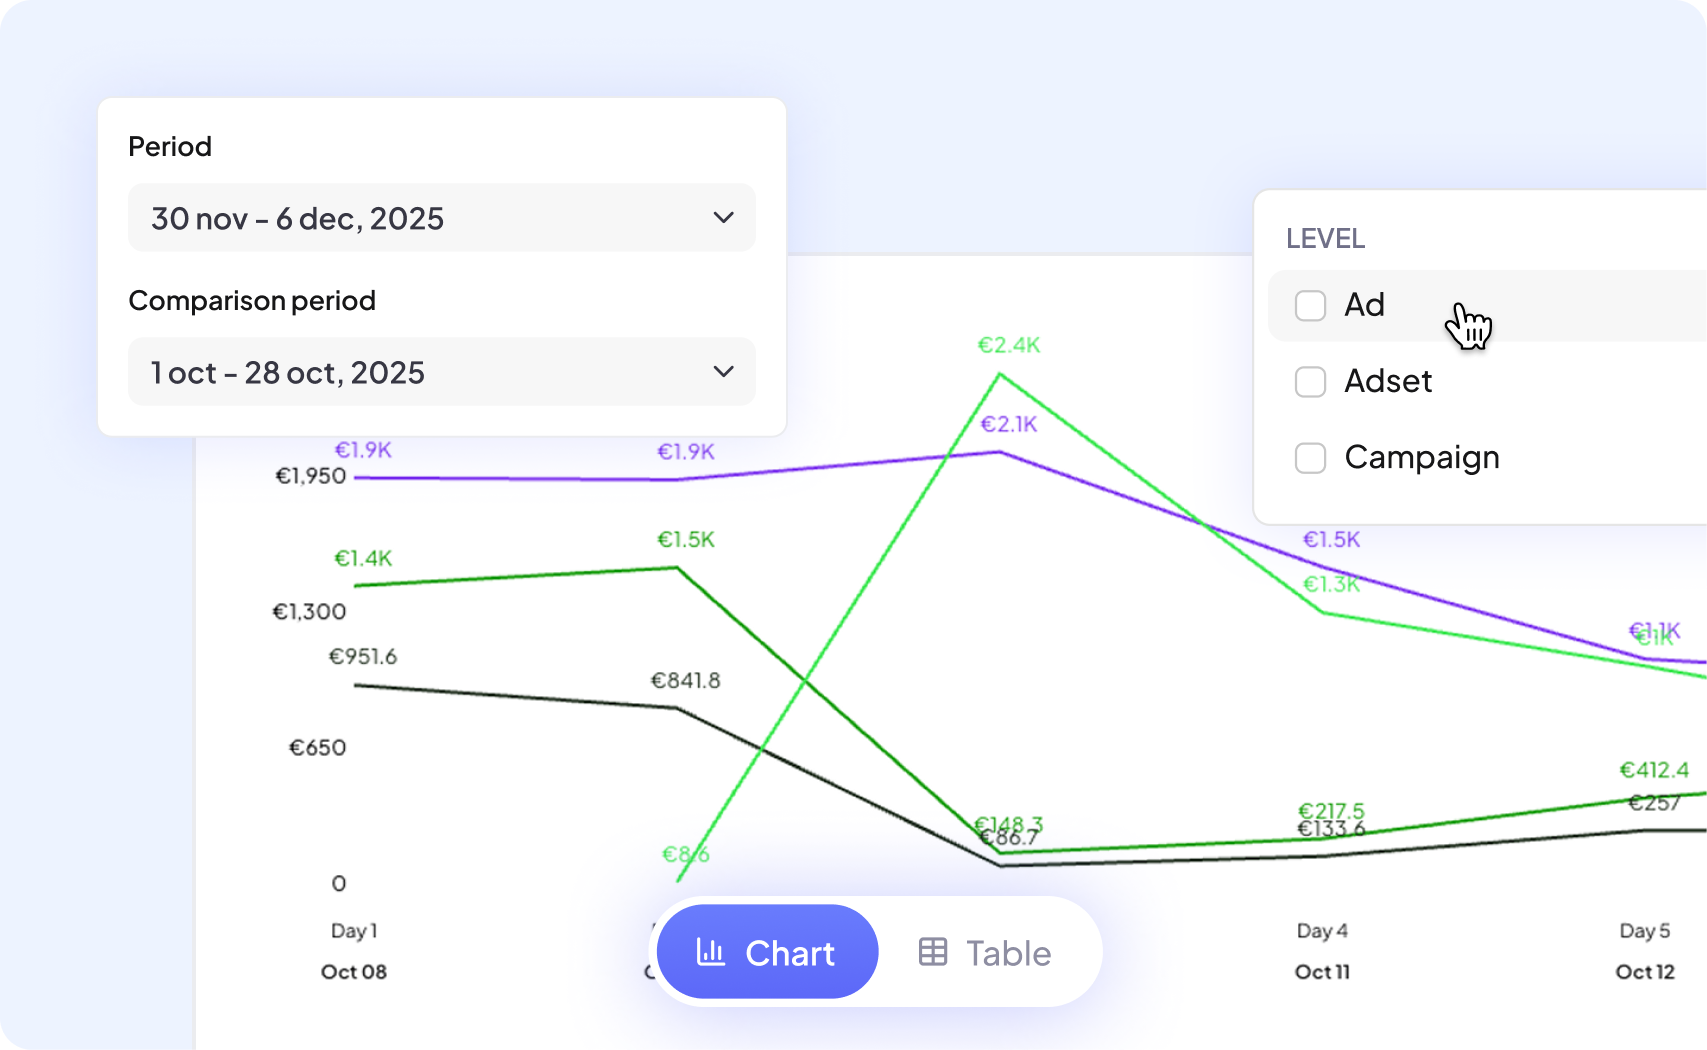
Custom attribution window
Adjust your attribution window in one click to align results with your real business cycles — from short-term boosts to long-term conversions.

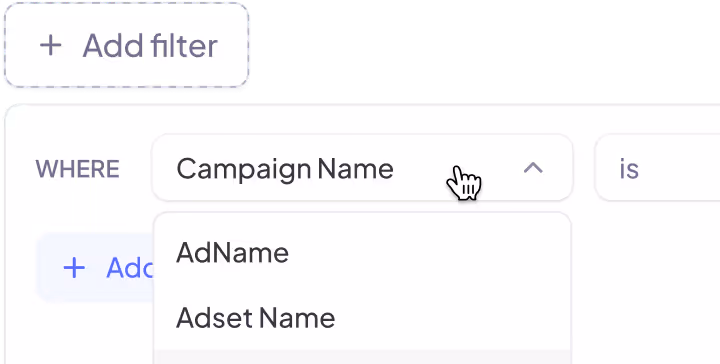
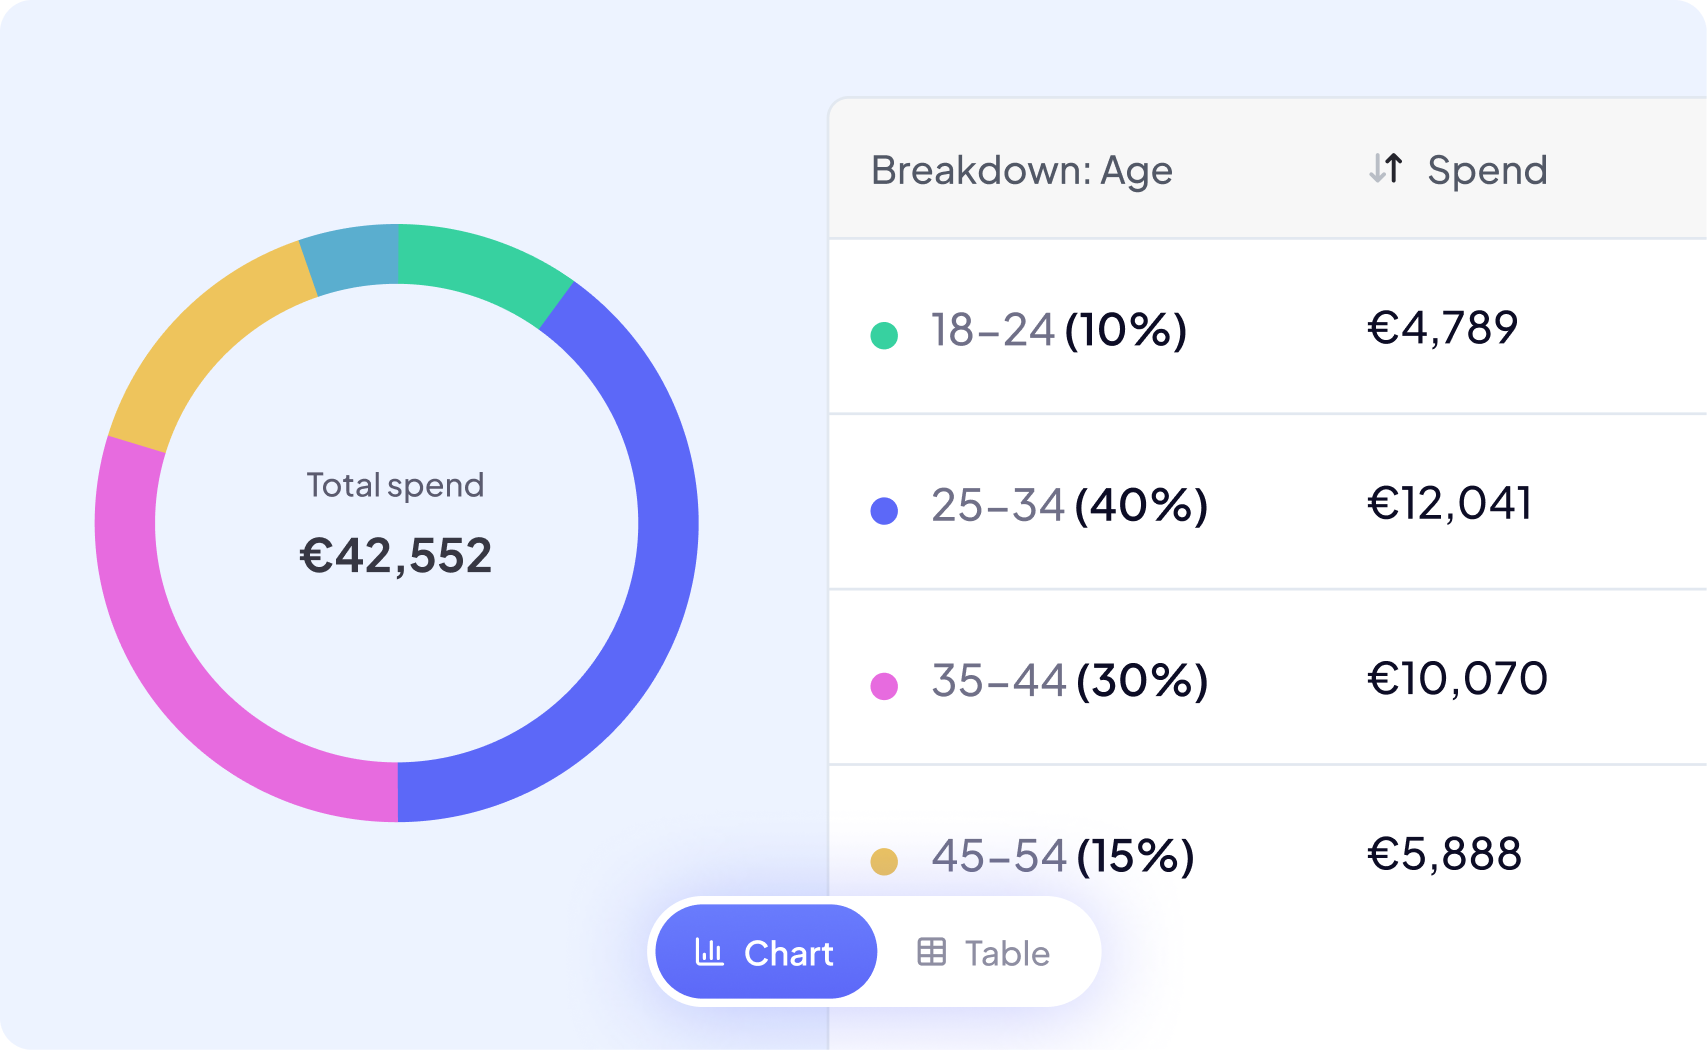
Advanced filtering
Create custom filters to focus on what matters most — whether it’s a specific product, audience segment, or platform.
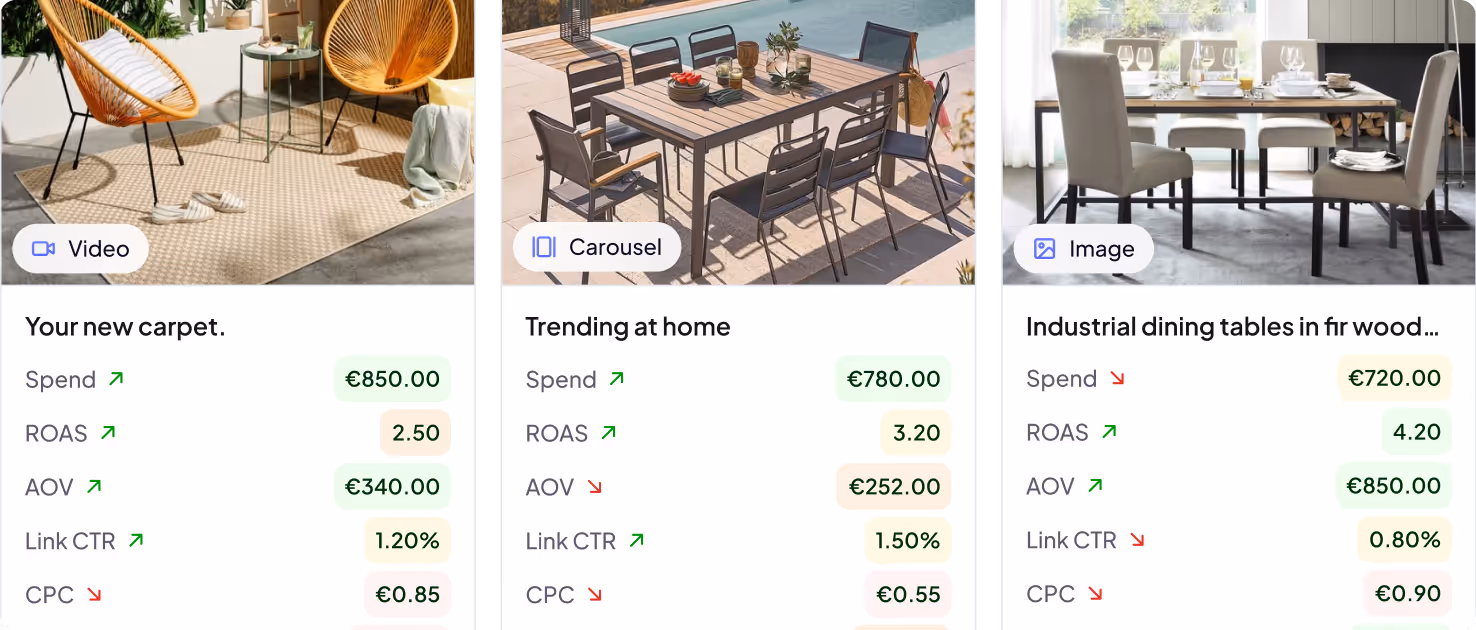
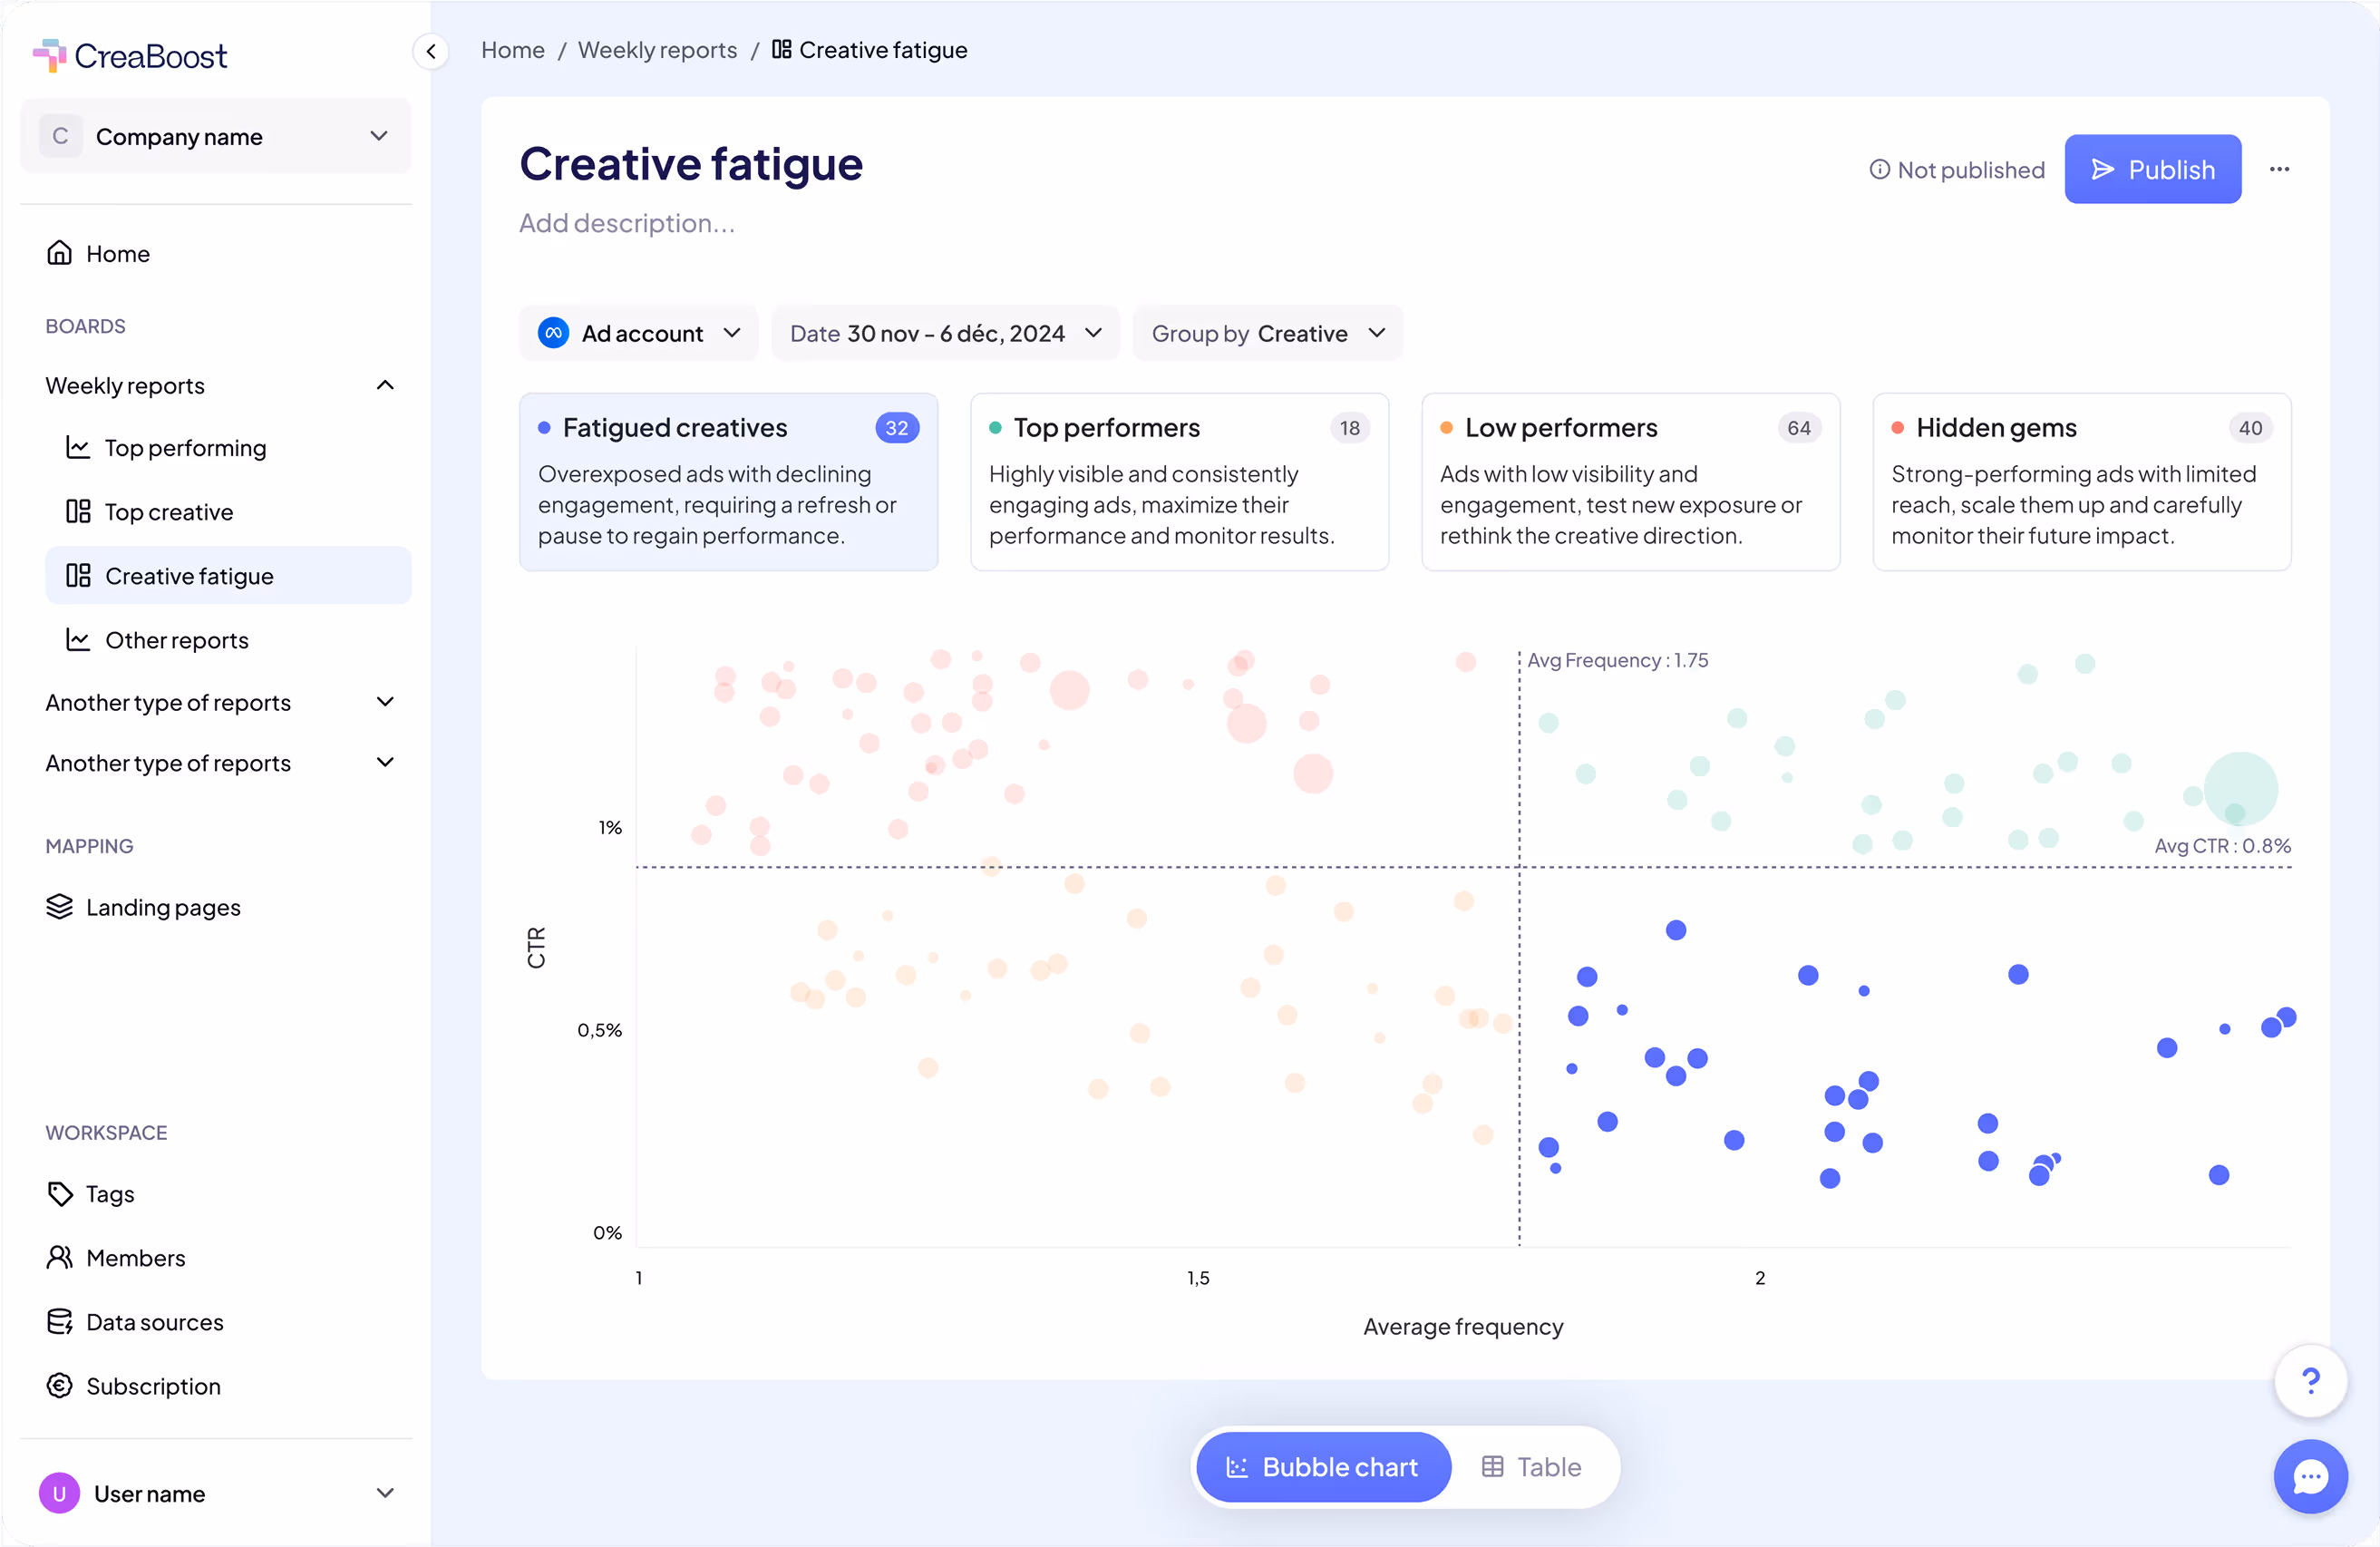
Automatic segmentation
CreaBoost automatically classifies your ads into four performance quartiles — green, yellow, orange, and red — so you instantly know which ones to scale, tweak, or stop.
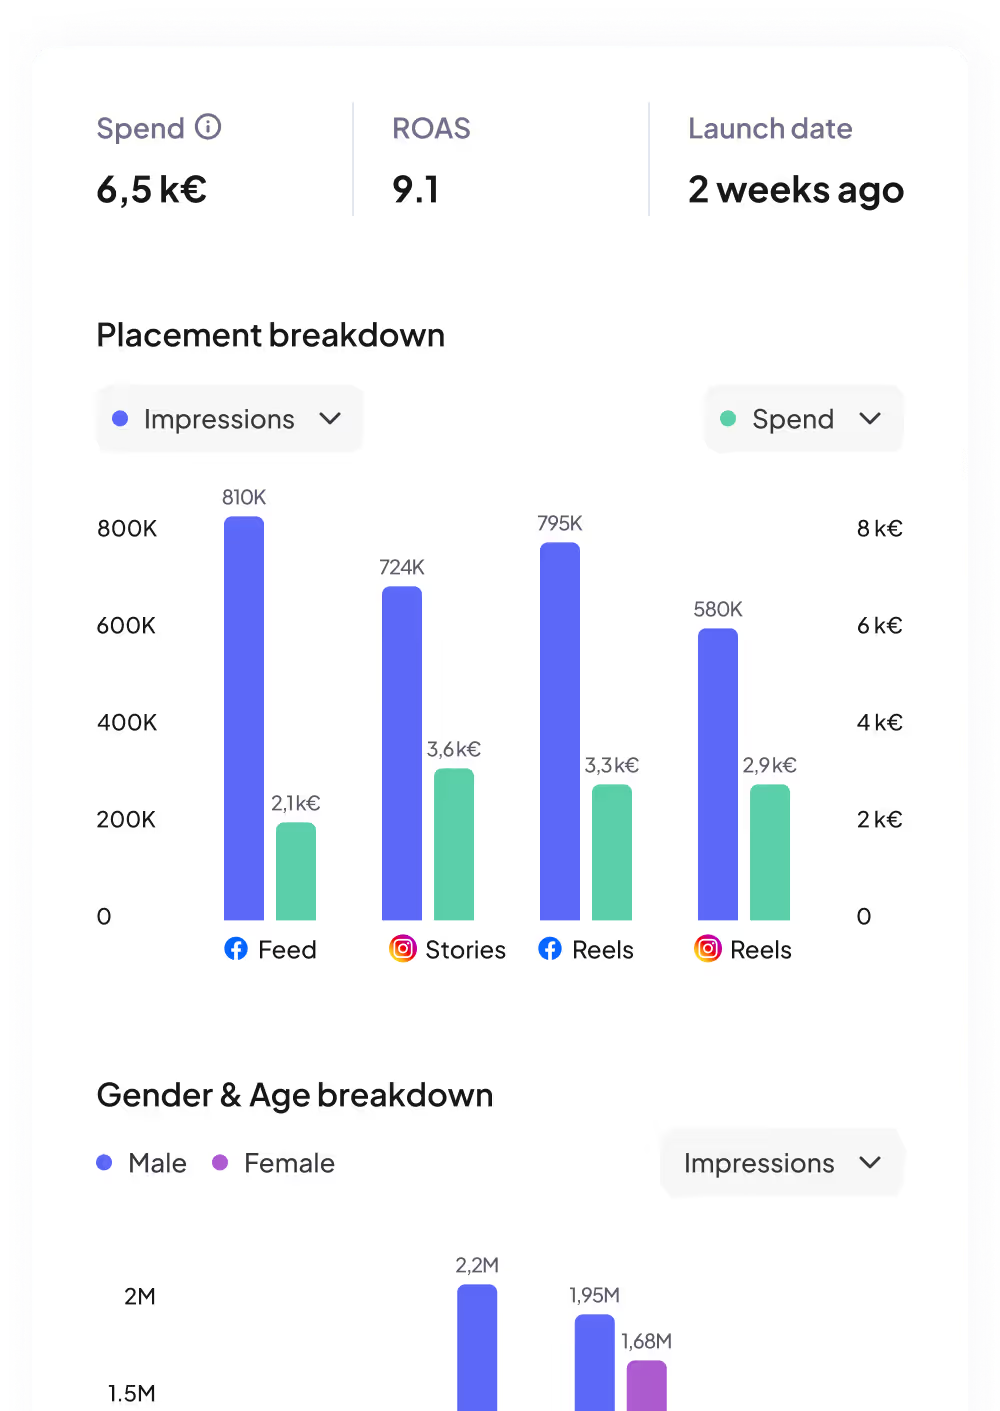
One Click Deep Dive
Explore any ad in detail with one click to uncover the creative and audience insights behind top results.
Trusted by 100+ agencies
who are winning with CreaBoost


Manon, Creative Strategist @Stride-Up
" The UX of CreaBoost is really well thought out. It’s super easy to use, both for clients and for AMs. Having a clear, visually appealing interface with a view of the creatives and key KPIs has just become essential "
Louis-Michel, General Director @AdBridge
" Creaboost has become a cornerstone of our support at AdBridge. By placing creative strategy at the heart of media performance, this tool allows us to build clear and insightful reports that help our clients precisely identify the creative drivers behind their advertising performance "
Antoine, CEO @Metalyde
"CreaBoost is essential for understanding and optimizing our ad performance. The insights are clear, actionable, and have significantly improved our ROI"
Maïlys, Team Leader Paid Media @Stride-Up
" I love CreaBoost. Honestly, it takes so much time to make something visual to present ad performance... But here, it’s all visual — ecom clients are going to love it. Honestly, the more I dig into this tool, the more I love it "
discover the REPORT in video
Spot your best ads
The most frequently asked questions
Everything you need to know about CreaBoost for agencies. If you need more information or want a full product walkthrough, feel free to book a demo with our team.
Can I select any metric?
Yes. You can choose any performance metric — ROAS, CTR, CPC, engagement rate, or even your own custom metric — to define what “top performing” means for your analysis.
Can I change the visualization?
Absolutely. Switch between charts, grids, or tables to explore your data the way you prefer. Every view updates instantly when you adjust filters or metrics.
Can I sort by launch date?
Of course. Sort your ads by launch date to understand how new campaigns perform compared to older ones — perfect for spotting fresh winners early.
What is the 4-color segmentation based on?
The segmentation is based on performance quartiles over the last 12 months — from top 25% (green) to bottom 25% (red). It gives you an instant visual overview of what’s performing best (and what’s not).
More features on CreaBoost
Discover way more insights with other key features like Smart tagging, Custom metrics...

Dive deeper into each metric to understand how every element of your ads contributes to performance.
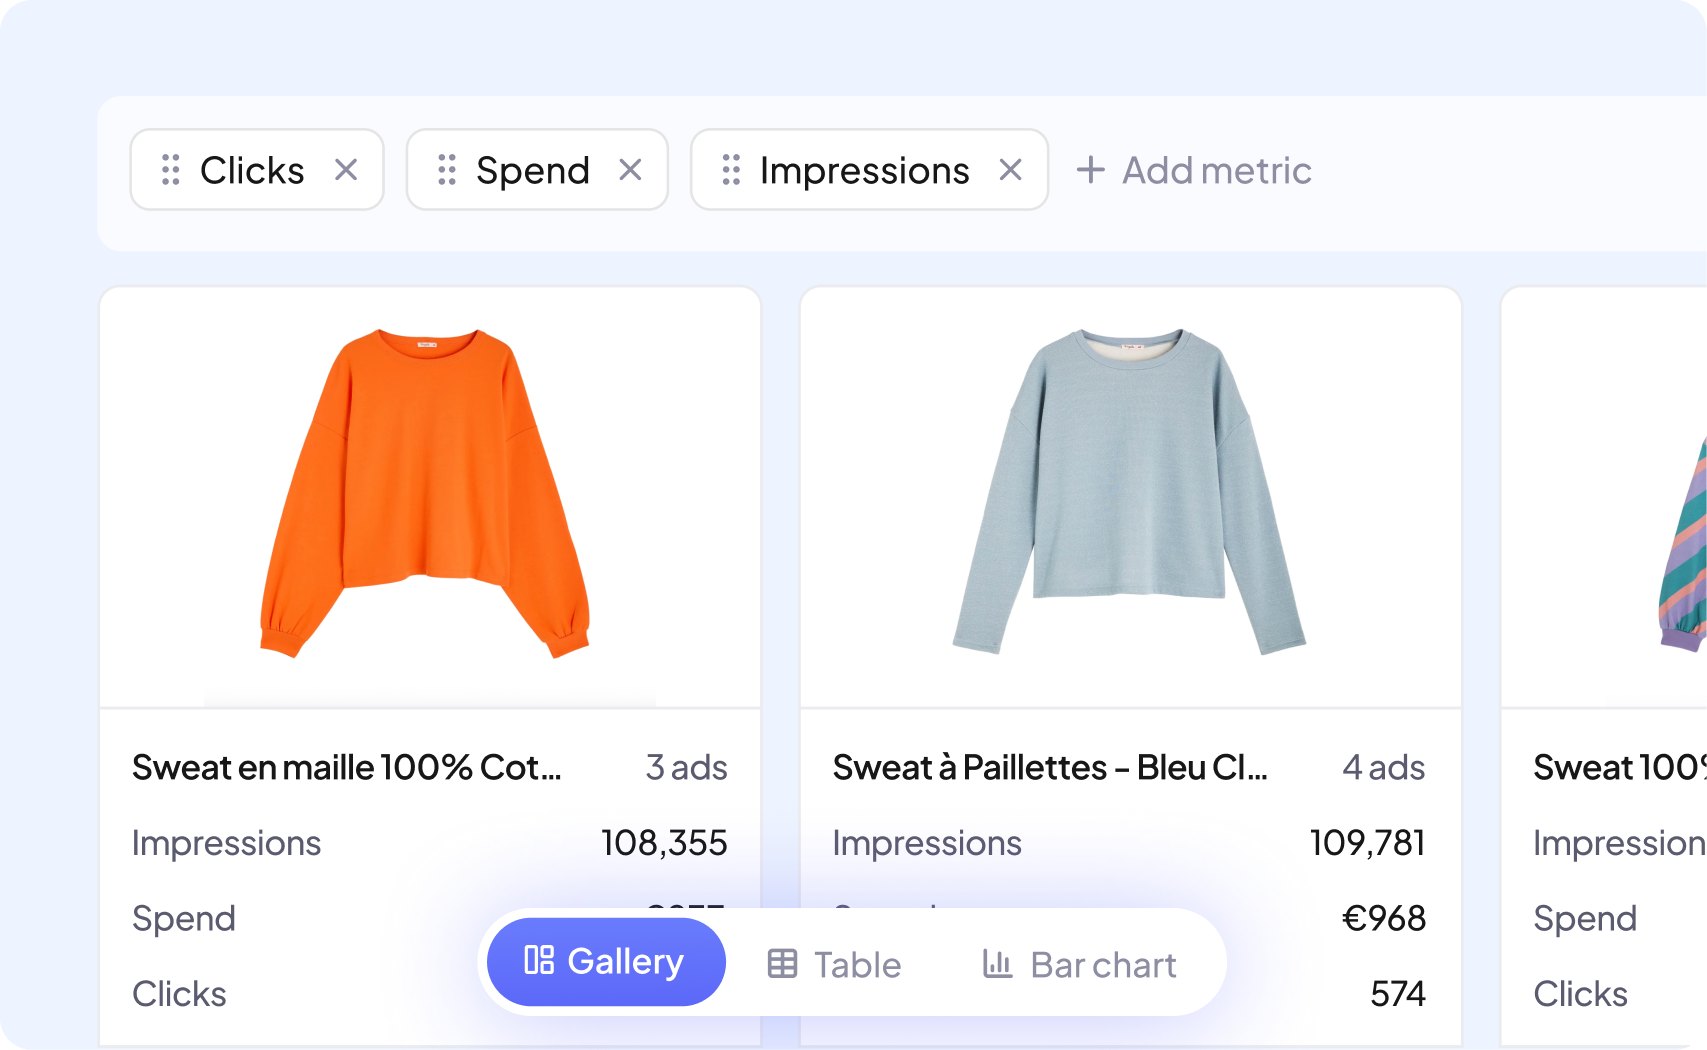
Identify the products that consistently drive the highest returns and double down on what sells.
Join 100+ agencies boosting their ads with CreaBoost.

Beautiful dashboards & Smart insights for your creatives.
FOLLOW US ON OUR SOCIALS