In the last few years, advertisers have mastered targeting, tracking, and bidding.
They know how to optimize cost per click, control ROAS, and automate budgets.
But there’s one area that’s still a black box for most performance teams:
the creative itself.
What makes one ad work while another flops?
Why does one image stop the scroll and another gets ignored?
Welcome to Creative Analytics — the discipline that finally connects the dots between your visuals and your results.
🎯 What Is Creative Analytics?
Creative Analytics is the process of measuring, understanding, and improving the visual elements of your ads — not just through intuition, but through data.
It’s the missing bridge between creative teams and performance marketers.
While traditional analytics tools focus on audience or spend, Creative Analytics focuses on what’s inside the ad:
- The format (static, video, carousel)
- The presence of people or products
- The colors, backgrounds, or framing
- The hook, text overlay, or CTA
- The emotional tone or visual style
By analyzing these attributes across hundreds or thousands of creatives, brands can finally understand why their top ads perform — and how to reproduce success.
⚙️ How It Works
Behind the scenes, Creative Analytics platforms (like Creaboost) use a mix of:
- Computer vision — to detect what’s visually present in each ad,
- Natural language processing — to analyze ad copy and naming conventions,
- Data modeling — to link visual traits to performance outcomes (CTR, ROAS, CPA).
This turns creative performance into a structured dataset that can be queried, filtered, and compared.
In other words: your creative library becomes a database — not just a folder full of assets.
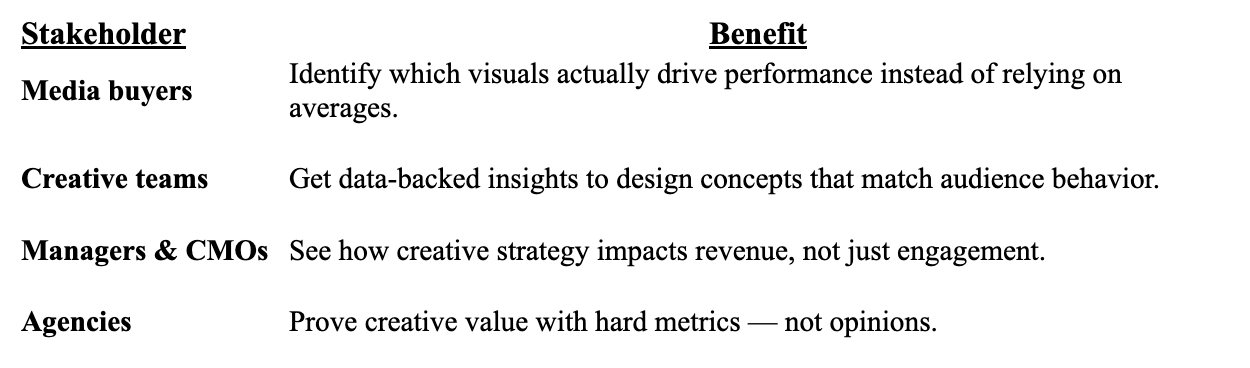
💡 Why It Matters
Creative Analytics changes how marketing teams make decisions at every level:
It’s not about replacing intuition.
It’s about backing it up with evidence.
🔍 Key Questions Creative Analytics Can Answer
With the right setup, Creative Analytics helps you answer questions that were impossible to quantify before:
- Do ads featuring people perform better than product-only visuals?
- Which angles, colors, or moods correlate with high CTR?
- What’s the average lifespan of a creative before fatigue sets in?
- Which hooks or text overlays drive engagement?
- Are we overusing certain themes or formats?
Every answer helps you spend smarter, test faster, and create better.
🧠 From Reporting to Insight
Most advertisers already have dashboards — but dashboards are descriptive.
Creative Analytics is diagnostic and predictive.
It doesn’t just show what happened.
It helps you understand why and what to do next.
For example:
- “CTR dropped by 25%” → classic reporting.
- “CTR dropped because the ad uses a background color that historically underperforms with women 25–34” → creative analytics.
This level of granularity transforms creative decisions from guesswork into science.
🧩 Examples of Creative Analytics in Action
1. Finding visual patterns that drive clicks
By tagging and comparing all your creatives, you can discover that videos with close-up product shots outperform lifestyle scenes, or that UGC-style edits deliver 2× higher engagement than polished studio content.
2. Detecting early creative fatigue
By tracking metrics like CTR × Frequency or Spend × ROAS, you can identify when a creative starts losing effectiveness and refresh it proactively.
3. Testing hypotheses visually
Want to know if blue backgrounds perform better than neutral tones? Or if female voiceovers drive higher engagement?
Creative Analytics lets you isolate those variables and measure them objectively.
⚡ From Data to Action
The power of Creative Analytics lies in its ability to close the loop between data and creation.
- Measure → What creative traits drive performance?
- Learn → Which visuals resonate with which audience?
- Act → Produce new creatives based on those insights.
- Repeat → Monitor fatigue, iterate, and optimize.
This loop turns creative production into a measurable growth engine.
The next generation of ad performance won’t come from bigger budgets — but from smarter creative decisions.
✨ The Future of Creative Intelligence
Creative Analytics is more than a trend — it’s the foundation of creative intelligence.
As AI tools like Nanobanana generate new visuals automatically, the insights from Creative Analytics ensure those generations are data-guided, not random.
The combination of:
- Creative Analytics (understand what works), and
- Generative AI (produce more of what works)
…creates a self-improving ecosystem of creative performance.
📈 Why Creaboost Leads the Way
Creaboost was built around this exact vision:
to give advertisers and agencies a 360° view of creative performance, powered by AI-driven analysis.
With features like:
- Smart Tagging (automatically detect creative attributes),
- Creative Fatigue report (track decline and refresh opportunities),
- Top Performers dashboard (visualize winning ads instantly),
Creaboost helps teams make creative decisions as confidently as they make media ones.
Because creative performance isn’t just art — it’s data waiting to be understood.
🔗 Related Articles
- 🎨 How Generative AI Is Revolutionizing Ad Creation
- 🪫 The Hidden Killer of Ad Performance: Creative Fatigue
- 🧩 Naming Convention Guide for Media Buyers
🚀 Ready to Turn Creative Data Into Growth?
Creaboost helps performance teams connect their creative content to real business results — by making every image, video, and ad measurable.
👉 Try Creaboost and see how your ads truly perform.